I have been developing OpenUBEM, an open-source toolkit for urban building energy modeling. Give it a neighbourhood (an address, a coordinate bounding box, or a GIS footprint export) and it estimates the annual energy consumption, hourly load profiles, and operational carbon emissions of every building inside it, without needing per-building utility audits.
How it works
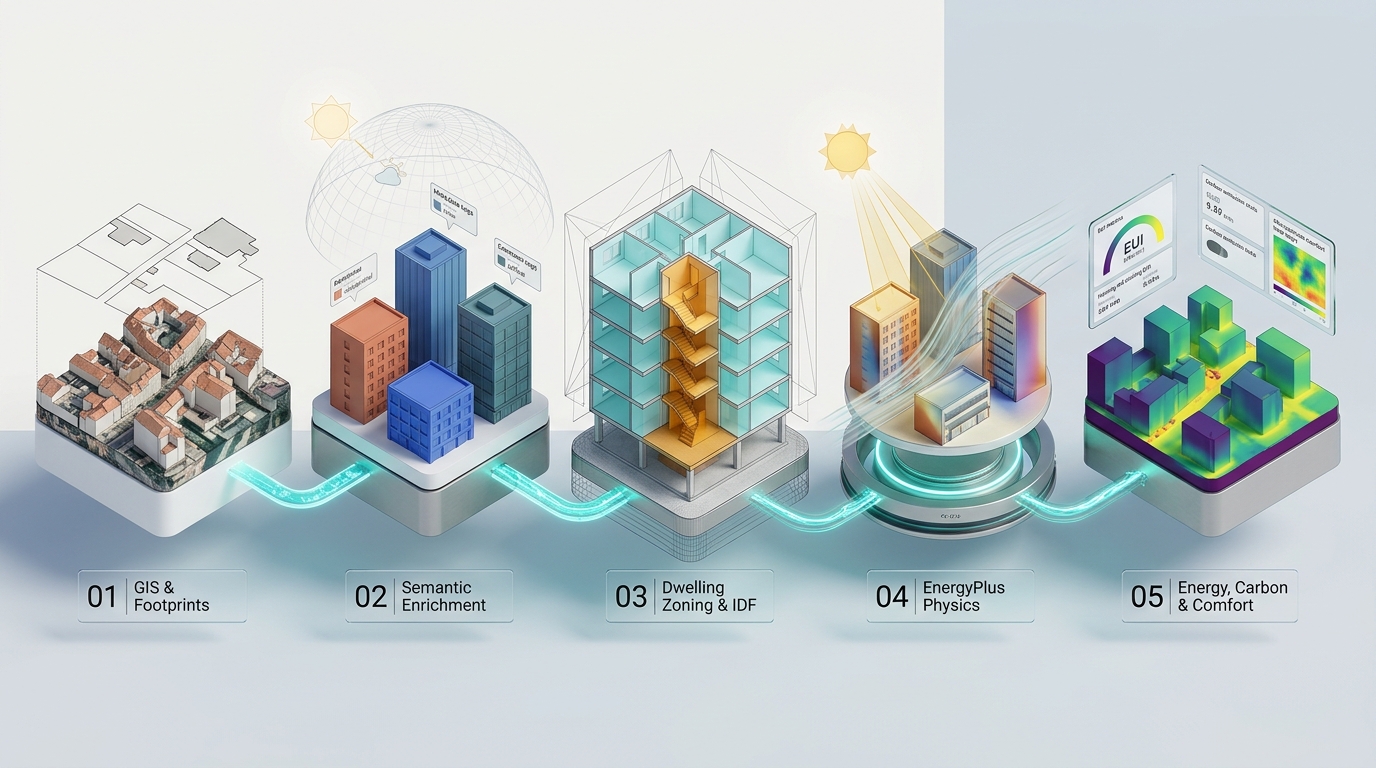
Each building is assigned an archetype, resolved into multi-dwelling thermal zones, extruded from its real footprint polygon with 20 m context shading, and simulated with whole-building EnergyPlus physics. The workflow is a modular, resume-capable pipeline:
- Data acquisition: OpenStreetMap, cadastre, and 3D building data.
- Semantic enrichment: building archetypes and ERA5 climate.
- IDF generation: dwelling layouts and the shading envelope.
- EnergyPlus simulation: multi-process runs.
- Results and carbon accounting: with an interactive 3D viewer.
An optional sixth step adds outdoor microclimate (UTCI/PET).
Key features
- Every reported kWh comes from native EnergyPlus meters, with no fitted multipliers.
- True footprint geometry with context shading, not shoebox proxies.
- US archetypes (DOE/ASHRAE 90.1) and European building stocks (TABULA/EPISCOPE).
- Standalone WebGL 3D viewers that need no server.
- Every input field carries a provenance token: observed, imputed, or standard default.
Where it has run
OpenUBEM has been executed across 10 residential districts in 10 countries on 4 continents, and checked against NYC Local Law 84, CBECS 2018, and LA EBEWE benchmarks.
Get it
OpenUBEM is dual-licensed under Apache 2.0 or MIT. The code, installation steps, and full documentation are on GitHub: github.com/orcunkoraliseri/OpenUBEM. It is also listed under My Tools on the Skills & Tools page.